Osaka City Resale Condo Sales Report, October 2026: 415 Sales, Median ¥623k per ㎡
415 resale condos sold across 24 Osaka City wards in October 2026, at a median ¥623k per ㎡ (+7.2% month on month). Ward-level 3-month prices, age and size breakdowns, and the busiest neighborhoods.
This month at a glance
In October 2026, 415 resale condominiums sold across 24 wards of Osaka City. The median price was ¥623k per square meter, with the middle half of sales between ¥383k and ¥864k. The median sale price was ¥32.0 million and the median floor area 62.9㎡. [1]
- Sales were +2.5% on the previous month and the median price per ㎡ +7.2%. [1]
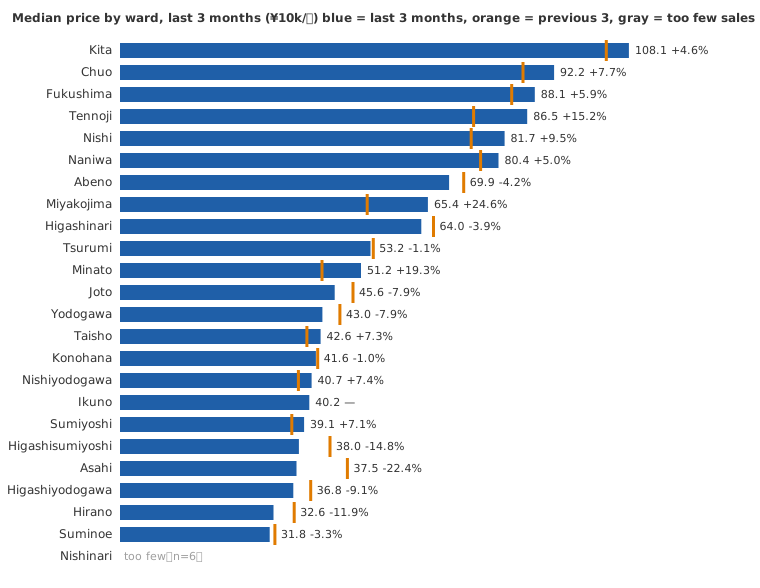
- Miyakojima Ward saw the largest rise over the last 3 months: a median ¥654k per ㎡, against ¥525k in the 3 months before (+24.6%). [1]
- Hirano Ward saw the largest fall over the last 3 months: a median ¥326k per ㎡, against ¥370k in the 3 months before (-11.9%). [1]
- Chuo Ward recorded the most sales this month: 55. [1]
Early November 2026
As of Nov 15, 2026, 87 sales had been registered for November 2026, at a median ¥472k per ㎡ and a median sale price of ¥26.8 million. Sales are registered a few days after contract, so the count will rise by month end and the price is only indicative for now; the full figures follow in next month's report. [1]
Sales by ward (last 3 months)
Monthly sales per ward are small, so ward prices combine the last 3 months (Aug 1, 2026 to Oct 31, 2026) and are compared with the 3 months before. Wards with fewer than 10 sales show no price. [1]
| Ward | Sales this month | Sales, 3 months | Median per ㎡ | Middle half | vs previous 3 months |
|---|---|---|---|---|---|
| Kita | 43 | 150 | ¥1,081k | ¥689k–¥1,564k | +4.6% |
| Chuo | 55 | 131 | ¥922k | ¥702k–¥1,199k | +7.7% |
| Yodogawa | 36 | 102 | ¥430k | ¥317k–¥622k | -7.9% |
| Nishi | 38 | 100 | ¥817k | ¥518k–¥993k | +9.5% |
| Joto | 26 | 74 | ¥456k | ¥346k–¥610k | -7.9% |
| Fukushima | 21 | 65 | ¥881k | ¥725k–¥1,056k | +5.9% |
| Miyakojima | 23 | 64 | ¥654k | ¥460k–¥759k | +24.6% |
| Tennoji | 23 | 56 | ¥865k | ¥516k–¥1,131k | +15.2% |
| Higashiyodogawa | 13 | 45 | ¥368k | ¥293k–¥472k | -9.1% |
| Abeno | 15 | 44 | ¥699k | ¥643k–¥848k | -4.2% |
| Naniwa | 15 | 39 | ¥804k | ¥688k–¥919k | +5.0% |
| Hirano | 14 | 39 | ¥326k | ¥218k–¥427k | -11.9% |
| Nishiyodogawa | 12 | 38 | ¥407k | ¥309k–¥565k | +7.4% |
| Suminoe | 11 | 36 | ¥318k | ¥238k–¥478k | -3.3% |
| Asahi | 11 | 31 | ¥375k | ¥279k–¥527k | -22.4% |
| Tsurumi | 7 | 30 | ¥532k | ¥423k–¥601k | -1.1% |
| Sumiyoshi | 9 | 28 | ¥391k | ¥244k–¥538k | +7.1% |
| Konohana | 10 | 27 | ¥416k | ¥316k–¥442k | -1.0% |
| Minato | 10 | 26 | ¥512k | ¥391k–¥579k | +19.3% |
| Higashisumiyoshi | 8 | 23 | ¥380k | ¥310k–¥541k | -14.8% |
| Higashinari | 6 | 16 | ¥640k | — | -3.9% |
| Ikuno | 4 | 12 | ¥402k | — | — |
| Taisho | 4 | 10 | ¥426k | — | +7.3% |
| Nishinari | 1 | 6 | — | — | — |
By building age and size
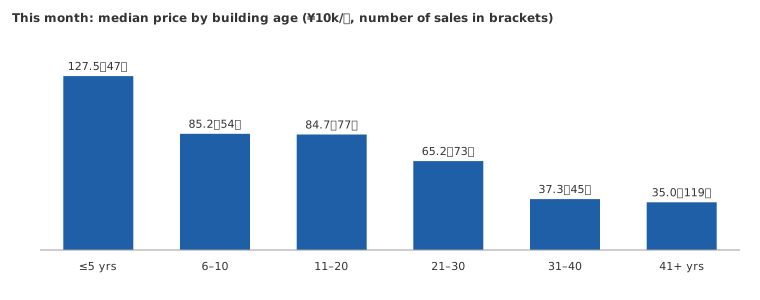
Split by building age, this month's sales show how steeply price per square meter falls as buildings get older. [1]
| Building age | Sales | Median per ㎡ |
|---|---|---|
| ≤5 yrs | 47 | ¥1,275k |
| 6–10 | 54 | ¥852k |
| 11–20 | 77 | ¥847k |
| 21–30 | 73 | ¥652k |
| 31–40 | 45 | ¥373k |
| 41+ yrs | 119 | ¥350k |
By floor area: [1]
| Floor area | Sales | Median per ㎡ |
|---|---|---|
| <30㎡ | 65 | ¥706k |
| 30–50㎡ | 54 | ¥504k |
| 50–70㎡ | 175 | ¥556k |
| 70–90㎡ | 106 | ¥698k |
| ≥90㎡ | 15 | ¥740k |
Busiest neighborhoods (last 12 months)
Neighborhoods with the most sales from Nov 1, 2025 to Oct 31, 2026. [1]
| Ward | Neighborhood | Sales | Median per ㎡ |
|---|---|---|---|
| Nishi | 南堀江 | 101 | ¥725k |
| Fukushima | 福島 | 96 | ¥1,098k |
| Kita | 豊崎 | 93 | ¥1,241k |
| Nishi | 新町 | 88 | ¥1,161k |
| Miyakojima | 友渕町 | 83 | ¥437k |
| Kita | 中津 | 68 | ¥880k |
| Yodogawa | 宮原 | 57 | ¥392k |
| Yodogawa | 西宮原 | 56 | ¥366k |
| Higashiyodogawa | 東中島 | 53 | ¥398k |
| Asahi | 高殿 | 51 | ¥409k |
| Joto | 関目 | 48 | ¥347k |
| Joto | 中央 | 48 | ¥526k |
The last 12 months
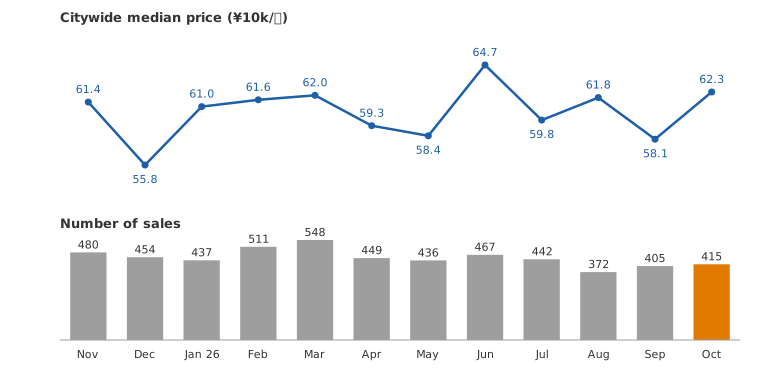
Citywide sales and median price per square meter by month: [1]
| Month | Sales | Median per ㎡ |
|---|---|---|
| November 2025 | 480 | ¥614k |
| December 2025 | 454 | ¥558k |
| January 2026 | 437 | ¥610k |
| February 2026 | 511 | ¥616k |
| March 2026 | 548 | ¥620k |
| April 2026 | 449 | ¥593k |
| May 2026 | 436 | ¥584k |
| June 2026 | 467 | ¥647k |
| July 2026 | 442 | ¥598k |
| August 2026 | 372 | ¥618k |
| September 2026 | 405 | ¥581k |
| October 2026 | 415 | ¥623k |
Source
Kinki REINS (Kinki Real Estate Information Network) sale records, compiled by Mitsuishi-inter. Price per square meter = sale price ÷ floor area. [1]
For prices in a particular ward or building, or what your own home might sell for, please contact us through the contact form.
Sources
- 公益社団法人近畿圏不動産流通機構(集計:三石国際不動産), 近畿レインズ 成約データ(三石国際不動産集計、成約日 2025-11-01~2026-10-31), Nov 15, 2026 (accessed Nov 15, 2026)
This article is general information, not investment, tax or legal advice. Figures are as of the publication of the sources listed and may have changed since. Please consult a professional for decisions about your situation.