What ¥30 Million or ¥50 Million Buys in Osaka: Resale Condo Price Bands Across 24 Wards
44% of Osaka City resale condo sales in the past year were under ¥30 million. That budget buys a 60–70㎡ family home in the outer wards but mostly a 20–30㎡ studio in the center. Price-band shares and sizes for all 24 wards.
The short version: ¥30 million buys a family home in the outer wards, mostly a studio in the center
Budget is usually the first number a buyer settles on. We split the 5,416 resale condominium sales in Osaka City registered with Kinki REINS from November 2025 to October 2026 into three price bands: under ¥30 million made up 44% of sales, ¥30–50 million 26%, and ¥50 million or more 30%. [1]
For sales under ¥30 million the citywide median floor area was 53.5㎡, but it was just 27.8㎡ in Kita and 68.0㎡ in Suminoe. The same budget buys a completely different home depending on the ward. [1]
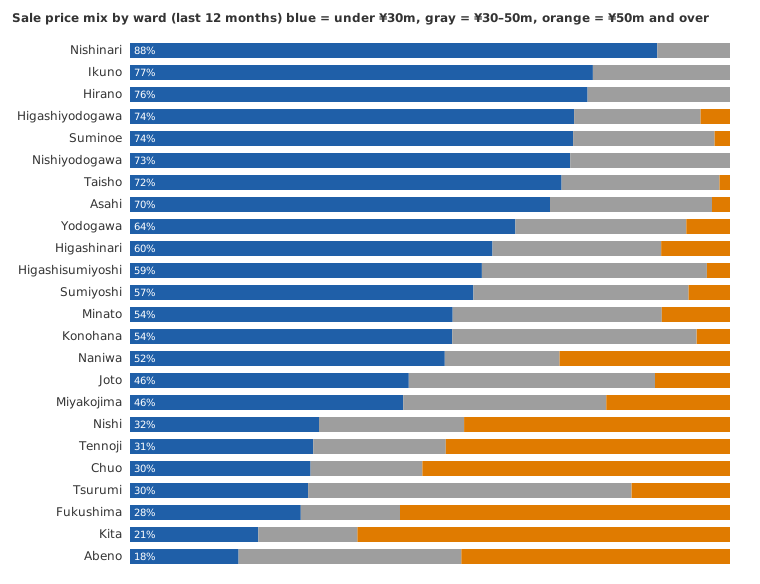
Price bands by ward
Wards are sorted by the share of sales under ¥30 million. Floor areas in square meters; where a band has fewer than 10 sales, no area is shown. [1]
| Ward | Sales | Under ¥30m | Median area | ¥30–50m | Median area | ¥50m+ |
|---|---|---|---|---|---|---|
| Nishinari | 33 | 88% | 58.9 | 12% | — | 0% |
| Ikuno | 35 | 77% | 56.4 | 23% | — | 0% |
| Hirano | 139 | 76% | 65.1 | 24% | 68.5 | 0% |
| Higashiyodogawa | 204 | 74% | 55.6 | 21% | 67.5 | 5% |
| Suminoe | 195 | 74% | 68.0 | 23% | 73.1 | 3% |
| Nishiyodogawa | 169 | 73% | 61.6 | 27% | 70.3 | 0% |
| Taisho | 57 | 72% | 61.6 | 26% | 68.4 | 2% |
| Asahi | 100 | 70% | 60.1 | 27% | 67.3 | 3% |
| Yodogawa | 439 | 64% | 46.9 | 29% | 69.0 | 7% |
| Higashinari | 96 | 60% | 36.3 | 29% | 68.4 | 11% |
| Higashisumiyoshi | 104 | 59% | 60.3 | 37% | 65.5 | 4% |
| Sumiyoshi | 145 | 57% | 61.6 | 36% | 72.3 | 7% |
| Minato | 132 | 54% | 56.1 | 35% | 69.3 | 11% |
| Konohana | 108 | 54% | 63.3 | 40% | 75.1 | 6% |
| Naniwa | 162 | 52% | 24.5 | 20% | 50.2 | 28% |
| Miyakojima | 257 | 46% | 54.8 | 33% | 71.3 | 21% |
| Joto | 312 | 46% | 60.8 | 42% | 70.9 | 12% |
| Nishi | 492 | 32% | 34.0 | 24% | 60.8 | 44% |
| Tennoji | 285 | 31% | 33.2 | 22% | 62.1 | 47% |
| Chuo | 671 | 30% | 25.7 | 19% | 55.0 | 51% |
| Tsurumi | 128 | 30% | 61.3 | 54% | 71.0 | 16% |
| Fukushima | 260 | 28% | 24.2 | 17% | 61.5 | 55% |
| Kita | 683 | 21% | 27.8 | 17% | 61.9 | 62% |
| Abeno | 210 | 18% | 52.7 | 37% | 69.6 | 45% |
Budget under ¥30 million
The outer wards offer plenty of choice. In Nishinari, Ikuno, Hirano, Higashiyodogawa, Suminoe, Nishiyodogawa, Taisho and Asahi, more than seven in ten sales were under ¥30 million, and the median area in this band was mostly 55–68㎡, family-sized homes with two or three bedrooms. The trade-off is age: many of these buildings are older, so factor in the repair reserve fee and future major repairs. [1]
The central wards also see sales in this band, 30% in Chuo and 52% in Naniwa, but the median area is only 24–34㎡, almost all studios for single occupants or investors. Buying a family home in the center on this budget is unrealistic. [1]
Budget ¥30–50 million
This is where family buyers concentrate. The citywide median area in this band is 67.2㎡, and in Miyakojima, Joto, Tsurumi, Sumiyoshi and Konohana it buys more than 70㎡. Tsurumi has 54% of its sales in this band, the highest share in the city, with relatively new buildings that suit families with a fixed budget. [1]
In the center the same money buys less space: 55.0㎡ in Chuo, 61.9㎡ in Kita and 61.5㎡ in Fukushima. Whether to pay for central convenience or for space further out is the most common choice in this band. [1]
Budget ¥50 million and over
In Kita 62% of sales were ¥50 million or more, followed by Fukushima at 55%, Chuo 51%, Tennoji 47%, Abeno 45% and Nishi 44%. High-end sales in these wards are mostly new, high-rise buildings near stations. Outer wards see few sales in this band; Hirano, Nishiyodogawa, Nishinari and Ikuno had none in the year. [1]
How to use the table
Set your budget first, check which wards have the most sales in that band and how much space it buys there, then go and view homes in those wards. Within a ward, distance to the station, building age and floor change prices a lot; the figures are medians, not the price of any particular home.
To search by budget, or to see which band your own home falls into, please contact us through the contact form.
Source
Kinki REINS (Kinki Real Estate Information Network) resale condominium sale records for Osaka City from November 1, 2025 to October 31, 2026, compiled by Mitsuishi-inter. [1]
Sources
- 公益社団法人近畿圏不動産流通機構(集計:三石国際不動産), 近畿レインズ 成約データ(三石国際不動産集計、成約日 2025-11-01~2026-10-31), Nov 15, 2026 (accessed Nov 15, 2026)
This article is general information, not investment, tax or legal advice. Figures are as of the publication of the sources listed and may have changed since. Please consult a professional for decisions about your situation.